Know the reaction
before you ship it.
Test a message, a post or a campaign on audiences built from real people’s recorded behavior. See who likes it, who pushes back and why, before it goes out.
Checked on 1,500 real A/B tests: it named a winner on 44% and was right 87% of the time.
Stimulus
X“A 30-second spot for a carbon-neutral grocery range, priced the same as the regular one.”
Clear readWould you stop scrolling?
942 simulated answers- Would stop scrolling41 [34–48]
- Would keep scrolling34 [28–41]
- Would comment16 [11–22]
- Would share it9 [5–14]
Where the cohorts disagree
top answer, by cohort- High-reach entertainers52%
- Budget-conscious home cooks38%
- Healing & recovery creators24%
Example · 1/7
Built from
- audiences you can test
- 4,021
- every one of them listed in the app, ready to test
- people observed
- 62M
- grouped by what they engage with
The difference
Most synthetic audiences are invented. Ours were observed.
Others guess the audience
Most simulation tools invent a network and fill it with personas built from demographics. Those personas answer like a stereotype of a segment, not like the segment.
Ours was recorded
Every audience is compiled from accounts that exist, connected by follows we observed and described by what they posted. The counts come attached.
So it can be checked
Because we hold history, a prediction can be scored against something that already happened. A tool whose audience was generated has nothing to check against.
N 130 · E 130 · max degree 5
Nodes placed on a grid and wired at random. Everyone has the same number of connections, so there are no communities for an opinion to travel through, and nothing to check a prediction against.
N 130 · E 291 · max degree 28
Follows we recorded. Dense communities around a few high-reach accounts, and a handful of bridges between them: the structure that decides whether a message spreads or stalls.
What you get back
A result you can read in a minute and act on.
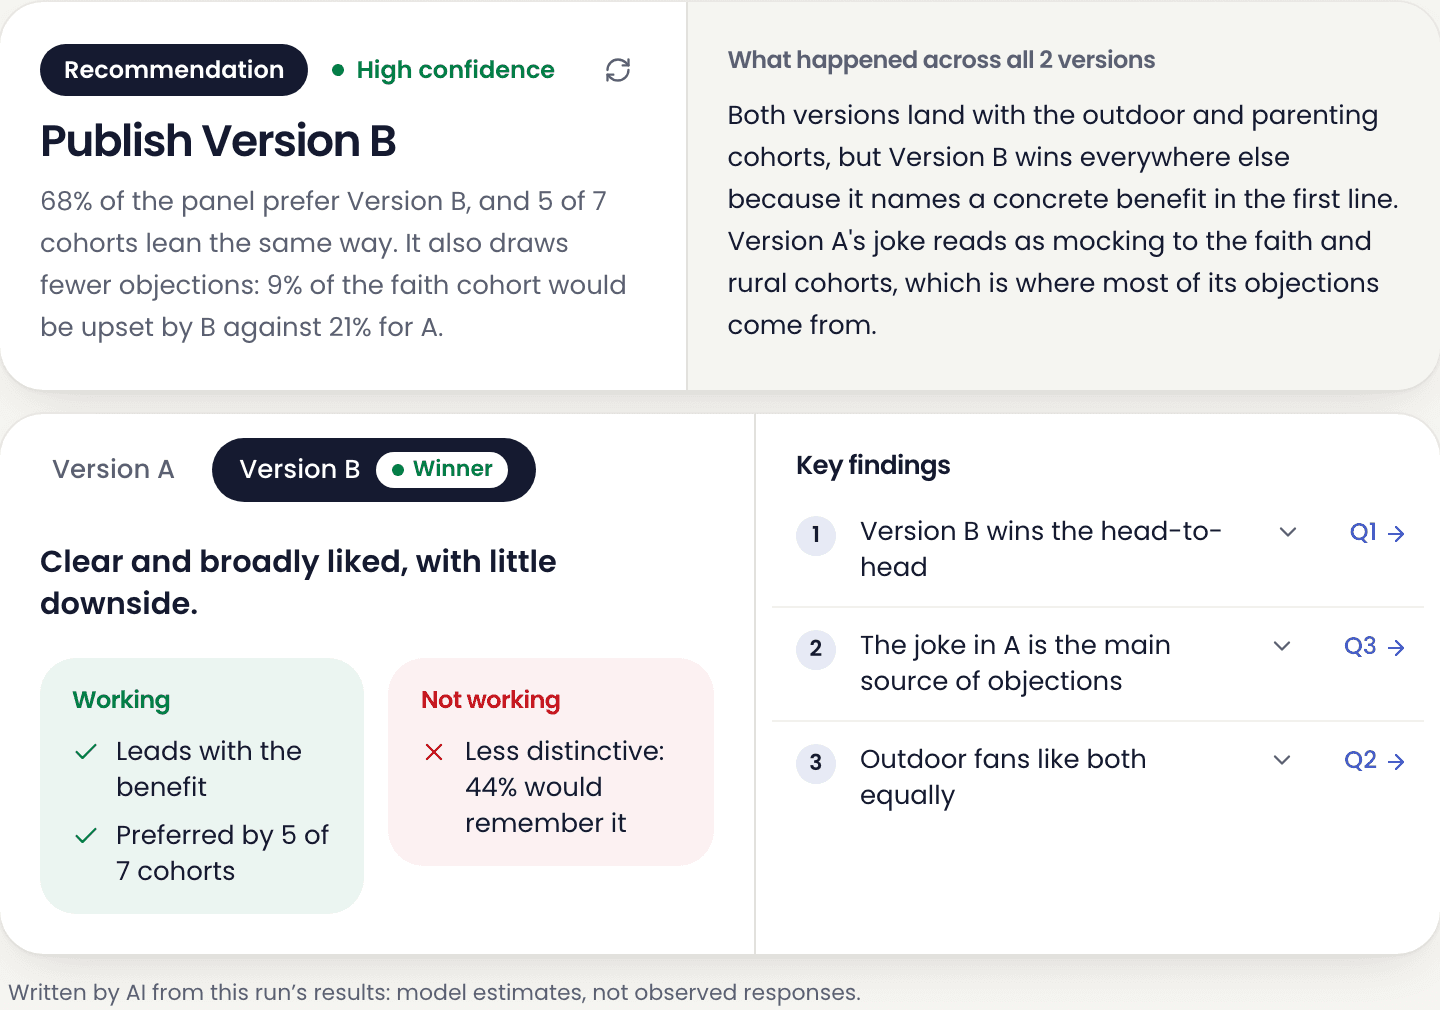
The report
A recommendation, not a spreadsheet
Every study ends with what to do: which version to publish, how sure the result is, what is working and what is not. Each finding links to the question it came from.
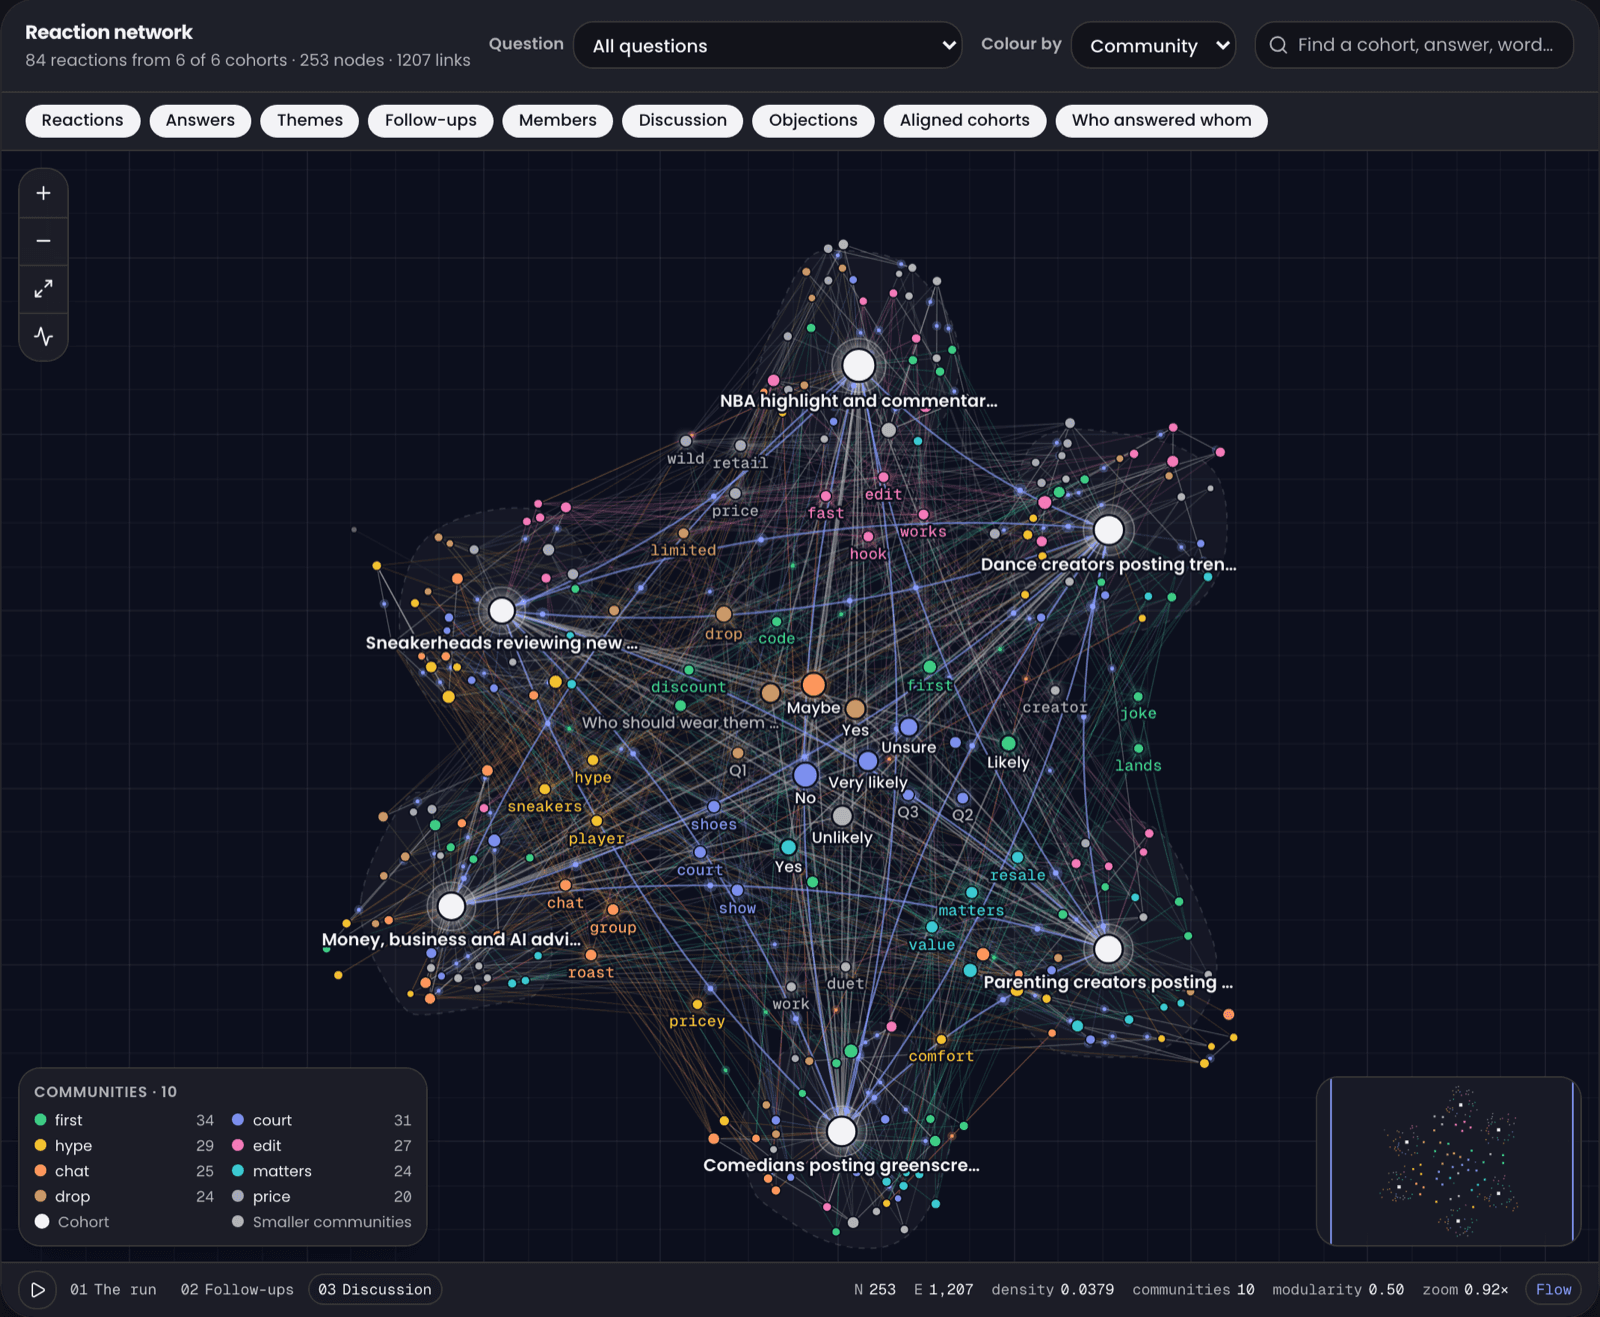
The reaction network
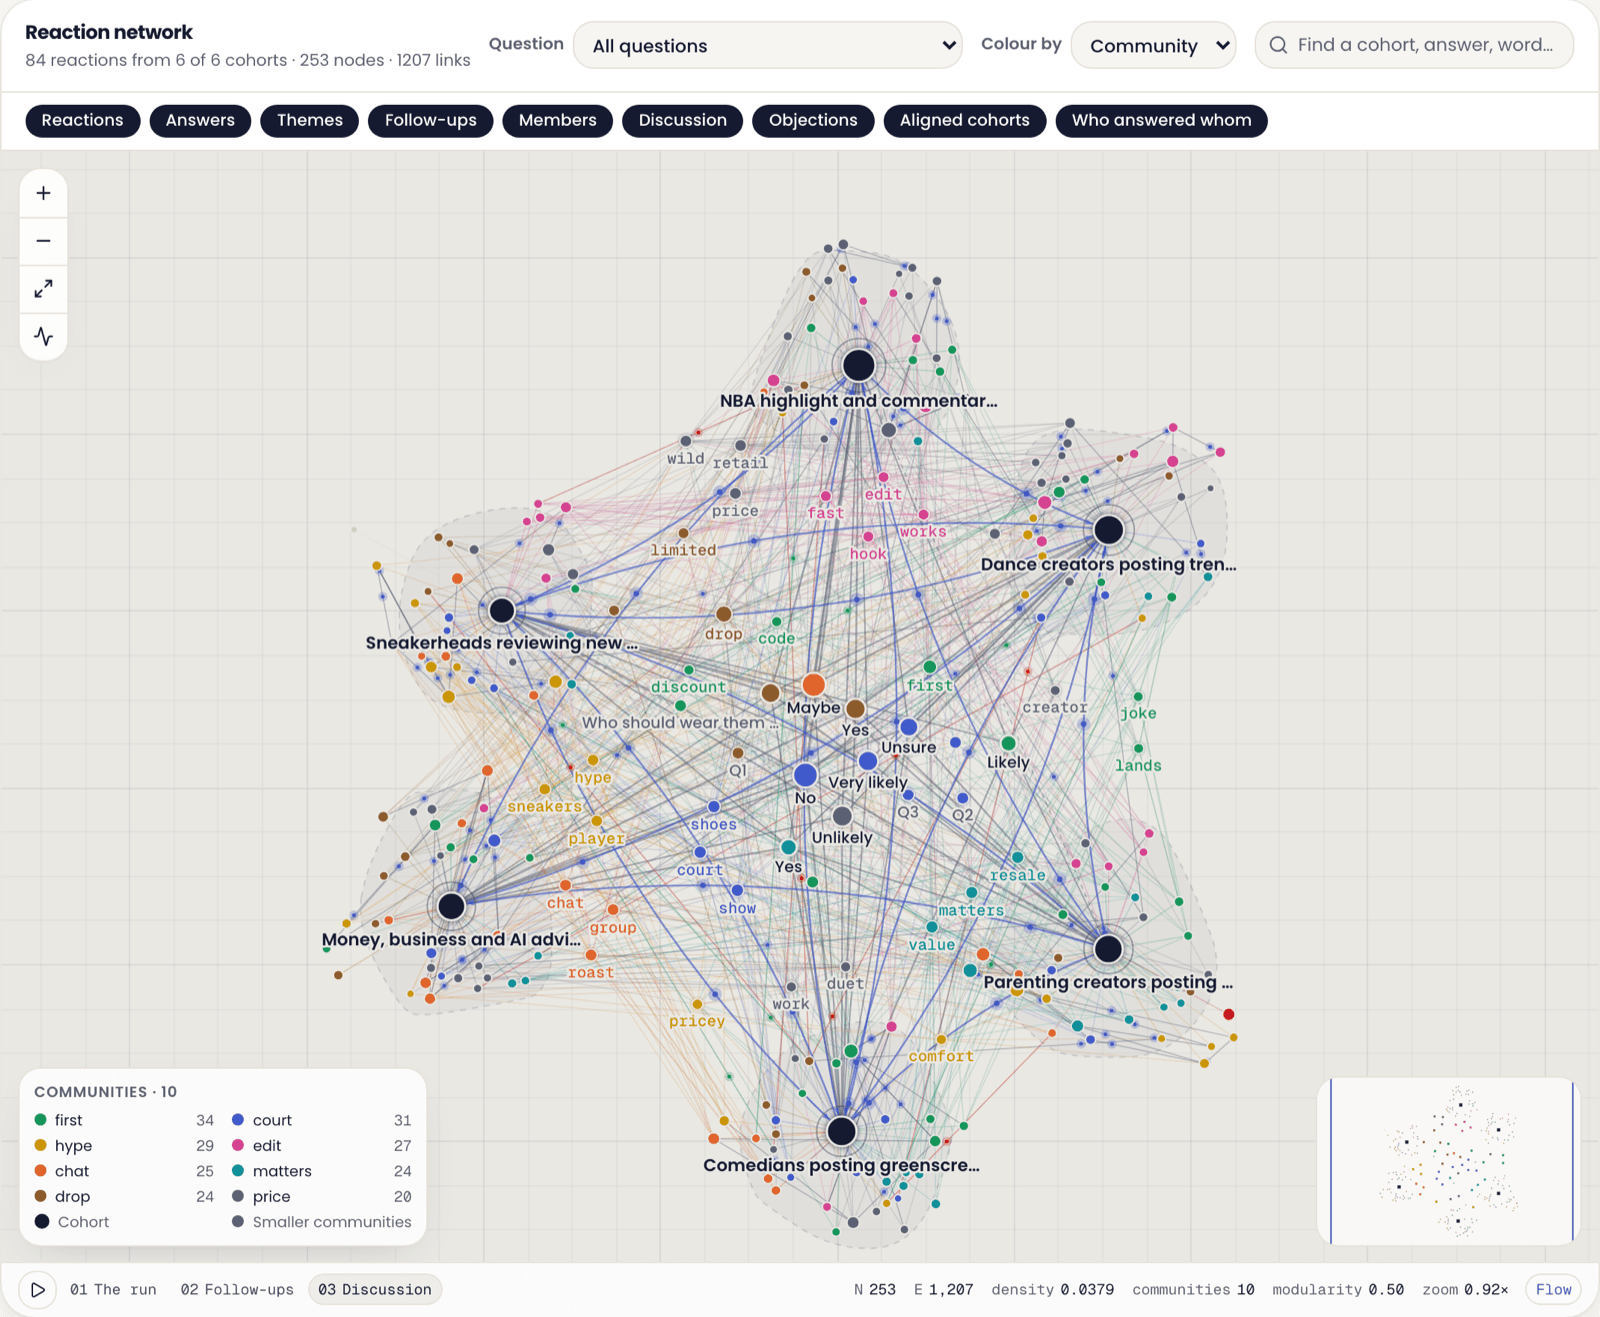
See how a reaction spreads
Follow the answers from cohort to cohort. The network shows which audiences agree, which split, and the words that carry each reaction between them.
Follow-ups
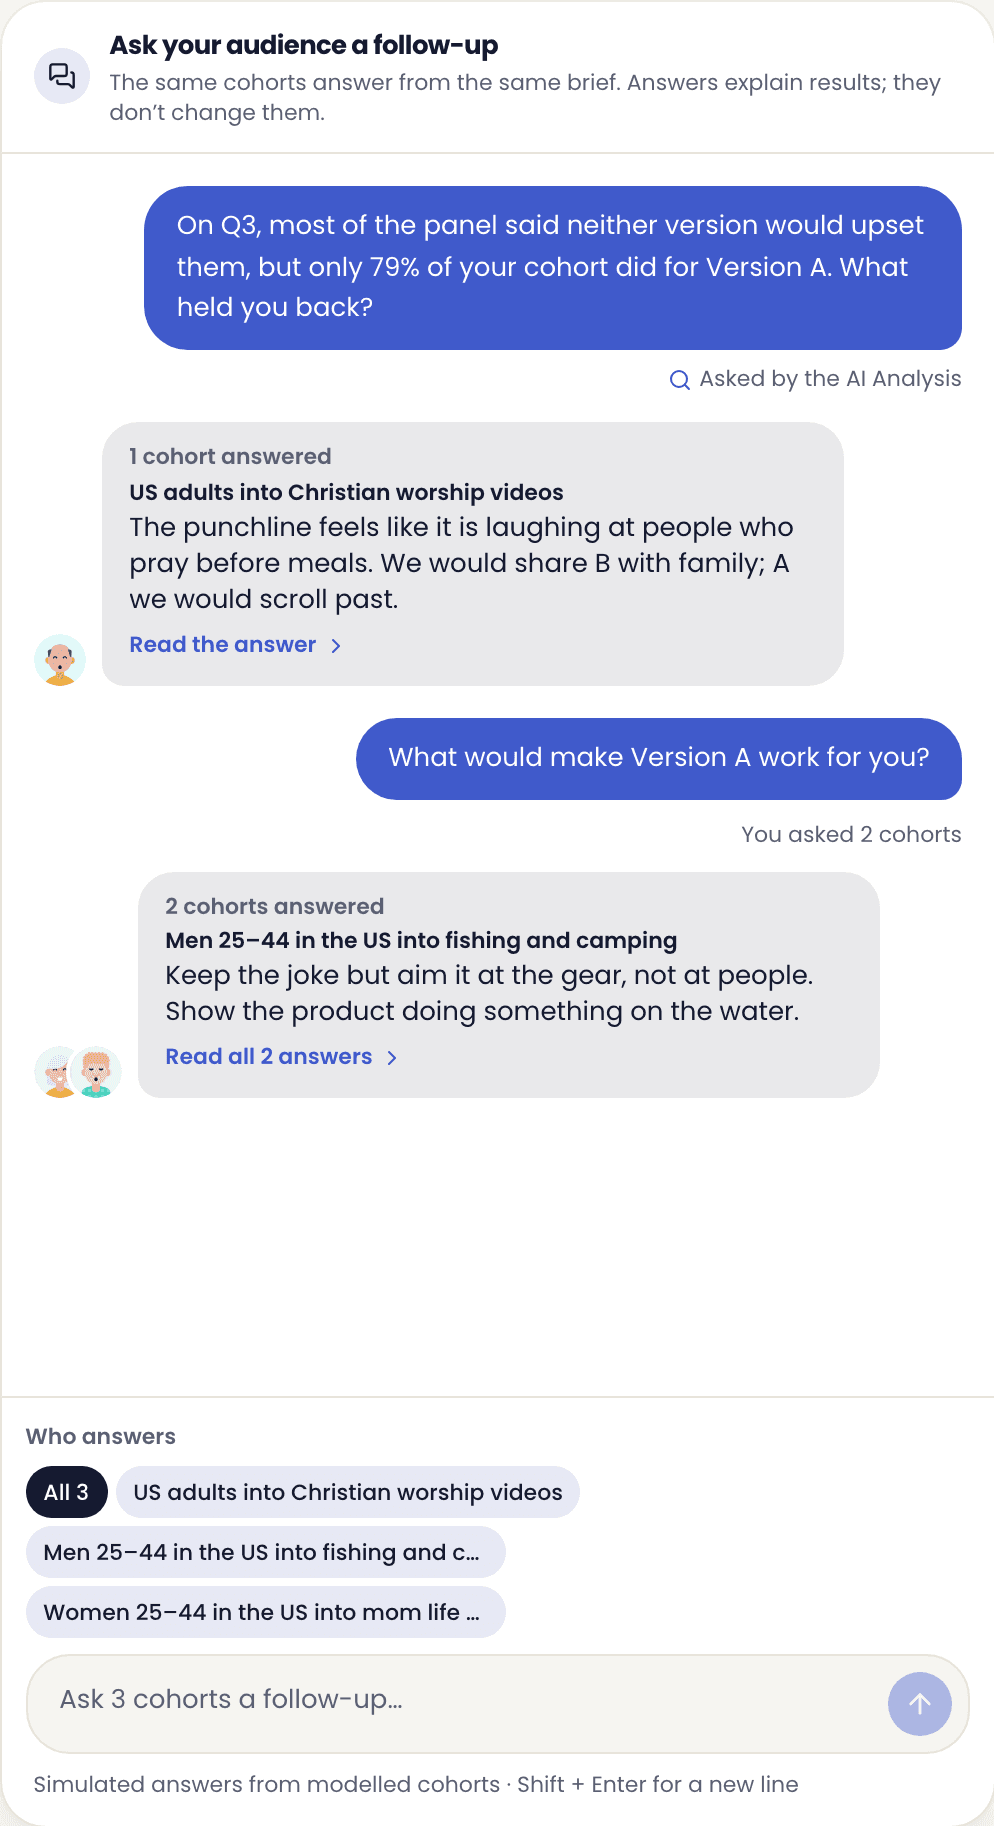
Ask the audience why
Ask a follow-up and each cohort answers in the way its members actually write, drawn from their recorded comments. Answers explain a result; they never change it.
How a study runs
Four steps, about a minute.
median run · 34s
- 1
Pick who to ask
Describe the audience in plain words, or browse the catalog by interest, creator or age and gender.
- 2
Load their real evidence
Each audience brings what its members actually posted, how they react and how they write.
- 3
See it spread
Where audiences are linked by what they engage with, reactions pass between them in rounds, the way opinion shifts online.
- 4
Read the result
Shares for every answer with their ranges, the reasons behind them, and what to test next.
What we will not claim
A simulation is only worth what its testing is worth.
Accuracy figures are easy to produce and hard to earn. Ours are measured on tests the model never saw, with the misses reported next to the wins. Where an audience is thin, the product says so on the audience.
Our A/B verdict, on real headline tests
1,500 held-out Upworthy news-headline A/B tests (2013 to 2015), each with a clear winner · named a winner on 44% · coin flip 50% · scored October 2026 on a simpler setup than a full study · no winner is called for images or video
- 01Every audience is an aggregate of at least 100 real accounts. It is never a single person, and never a stand-in for one.
- 02Audiences state their own limits. Creator audiences are labeled as leaning toward people who post, because they do.
- 03Results show real splits with their proportions instead of collapsing to one confident answer.
- 04Predictions are scored against outcomes we already recorded, not only against a control we designed.
Questions
What people ask first.
Is this real data?
The evidence is. Every audience is compiled from public accounts that already posted, followed and commented. The answers are simulated from that evidence, and the report labels them as model estimates.
How accurate is it?
On 1,500 held-out news-headline A/B tests that had a clear winner, Mimi named a winner on 44% and was right 87% of the time. The rest it called too close. That was scored in October 2026 on a simpler setup than a full study (one plain audience, no study questions), and other kinds of copy have not been scored on their own. Image and video comparisons have not passed a check on real ad results, so the report names no winner for them. Where a result has not passed a test like this, the report says so instead of naming a winner.
How long does a study take?
Half of studies return in about 35 seconds, and most within a minute. Follow-up chats and group discussions keep filling in while you read.
Test the reaction before you commit to it.
Bring a message, a concept or a campaign. Get back the split, the reasons and how sure it is, in about a minute.